
Investigating sinkholes by resistivity imaging
Resistivity geophysical surveys measure variations in the electrical resistivity of the ground, by applying small electric currents across arrays of ground electrodes. The survey data is processed to produce graphic depth sections of the thickness and resistivity of subsurface electrical layers. The resistivity sections are correlated with ground interfaces such as soil and fill layers or soil-bedrock interfaces, to provide engineers with detailed information on subsurface ground conditions.
Resistivity imaging, also known as electrical resistivity tomography (ERT) is a particularly useful survey method in clayey ground, where techniques such as Ground Penetrating Radar (GPR) are less effective. The method can also help to identify transitional boundaries in subsurface layers that can be difficult to detect using other geophysical methods and is a useful tool for locating deep seated sinkholes and mine workings.
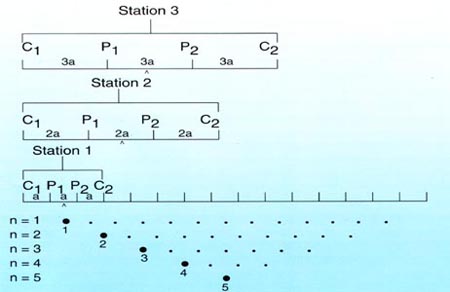
Resistivity imaging survey sampling sequence
Traditional resistivity surveys use four equidistant electrodes in a standard configuration. A low frequency current is applied across the outer electrodes and the voltage measured across the inner electrodes. The voltage is converted into a resistivity value representing average ground resistivity between the electrodes. Typical applications include electrical earthing and soil corrosivity testing
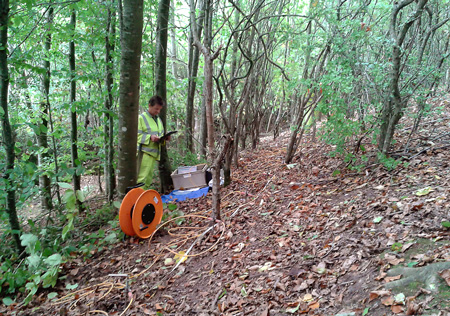
Depth probes provide models of vertical variations in ground resistivity using an expanding electrode array offset from a central reference point. Depth penetration increases with wider electrode separation, providing a one dimensional layered resistivity model. Composite sections are produced by interpolating between depth probes at regular intervals along a survey line. Resistivity Imaging also known as resistivity tomography, is an advanced development of the method. Enhanced data quality and resolution provide continuous two-dimensional resistivity models. Fifty or more electrodes are set-out in a regularly spaced array, connected to a computer-controlled resistivity meter via multicore cables.
Assessing slope stability by resistivity imaging
Unit electrode spacing is determined by parameters that include profile length, desired resolution and targeted depth penetration. A switching unit takes a series of constant separation readings along the length of the electrode array. The separation between sampled electrodes is then widened to increase the effective depth penetration and the procedure is repeated,as shown in the figure above. Readings are taken down to 20 levels of increasing depth range.
Advanced data processing using specialist inversion software removes distortions caused by the effects of electrode geometry, to produce a high resolution image of the variations in ground resistivity with depth. The model is contoured using a colour scale to produce a two-dimensional cross-sectional model of ground resistivity. Our geophysicists use the final resistivity imaging section to provide clients with a detailed interpretation of the ground conditions on site.
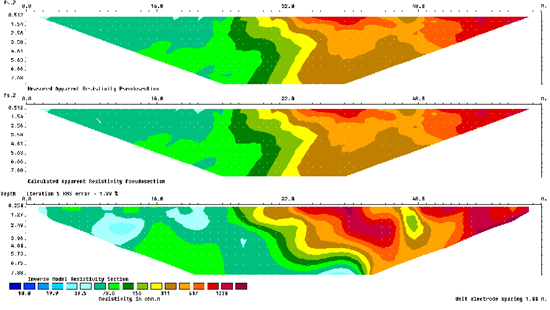
Modelled sections of an unconformable boundary in a road cutting
Measures bedrock & water table depth
Detects sinkholes & hidden voids
Geophysically maps buried alluvial channels
Profiles landslip geometry
Characterises fracture zones & discontinuities
Defines landfill sites and leachate contamination
Locates abandoned mineshafts and mine workings
Phone us at: +44-1905-619531 or e-mail us at: [email protected]